Coronavirus Thread

  • Thread starter Deleted member 2897
  • Start date
Status
Not open for further replies.

684Bee

Helluva Engineer
Messages
1,643
In the good news category: Read that a vaccinology professor at Oxford is 80% confident that we will have a vaccine by September. That would be pretty remarkable.
 
Messages
13,443
Location
Augusta, GA
In the good news category: Read that a vaccinology professor at Oxford is 80% confident that we will have a vaccine by September. That would be pretty remarkable.
But will it be tested and verified by then? If so, it will be a record for such work. They almost always require at least year to properly test, and sometimes much longer.
 

RonJohn

Helluva Engineer
Messages
4,995

So you said in some places, but not overall. What places on that chart indicate some places less than others? I am trying to understand if your prognostication has any merit or not.

Also, you have touted the vast number of tests being conducted in the USA, and the increases in the number of tests. Does an increase in diagnosed cases mean actually more cases, or can some of that be from more testing yielding more positives?

Looking at the predictions from IHME, the actual measurements seem to be following them fairly well. There are ups and downs, but if you draw a smooth curve through the data, it is close. On those charts, you can see a slow down in the actual data of hospitalizations, ICU patients, ventilators, and deaths. Those numbers are all at time of diagnosis to three weeks after diagnosis. In other words, those items will slow down up to three weeks after diagnosed cases slow down. Since those numbers are slowing down now, infections slowed down probably two to three weeks ago. That isn't indicated in the graph you posted, which is an indication that the numbers from that chart are highly influenced from better testing and not more infections.
 

Deleted member 2897

Guest
LOL. For many weeks we’ve shut the country down and we’re social distancing and I can’t see a single thing on that chart that shows the effect from it. Maybe I’m blind. Think about how we’re seeing 30,000 new cases week after week when we’re not even around each other. Meanwhile, the vast majority of the country according to the health experts isn’t expected to peak for a few more weeks even. BTW, when I look at testing volumes, they’ve been flat for weeks. So we’re getting a higher percentage of positives versus catching more people. Not sure what that tells us. Either way, it’s remarkable to me we can generate 30,000 more cases every week when we’re shut down.
 

RonJohn

Helluva Engineer
Messages
4,995
LOL. For many weeks we’ve shut the country down and we’re social distancing and I can’t see a single thing on that chart that shows the effect from it. Maybe I’m blind. Think about how we’re seeing 30,000 new cases week after week when we’re not even around each other. Meanwhile, the vast majority of the country according to the health experts isn’t expected to peak for a few more weeks even. BTW, when I look at testing volumes, they’ve been flat for weeks. So we’re getting a higher percentage of positives versus catching more people. Not sure what that tells us. Either way, it’s remarkable to me we can generate 30,000 more cases every week when we’re shut down.


Look at these charts:

https://covid19.healthdata.org/united-states-of-america

Especially deaths per day. Deaths per day are slowing down.

As I pointed out before, the chart you are looking at includes diagnosis because of increases in infections and diagnosis because of increases in numbers of tests conducted. This is definitely a case where you are looking for some piece of data that supports a claim instead of looking at data and arriving at a conclusion.

EDIT: It is also interesting that in your arguments, instead of answering questions and point in another direction. Social distancing isn't working ..... Who are you listening to? -- I am not listening to anyone I am looking at data. --- What data are you looking at? --- Well, you can see it in some places, but not others. -- What places? What data? -- Well, here is a single chart of the entire US(That doesn't separate places as you had specifically said your data did) -- That chart doesn't take into account differences in numbers of tests available, etc. -- Well I think this, I think that, you people don't know what you are talking about, etc. : You seem to be arguing a point without looking at anything other than what you believe to be true.
 
Last edited:
Messages
13,443
Location
Augusta, GA
LOL. For many weeks we’ve shut the country down and we’re social distancing and I can’t see a single thing on that chart that shows the effect from it. Maybe I’m blind. Think about how we’re seeing 30,000 new cases week after week when we’re not even around each other. Meanwhile, the vast majority of the country according to the health experts isn’t expected to peak for a few more weeks even. BTW, when I look at testing volumes, they’ve been flat for weeks. So we’re getting a higher percentage of positives versus catching more people. Not sure what that tells us. Either way, it’s remarkable to me we can generate 30,000 more cases every week when we’re shut down.
It would be impossible to see any kind of effect, one way or another, without also seeing a chart of the results if we had not engaged in social distancing. And that, of course, is impossible, because we DID engage in social distancing. What criteria are you using to say that social distancing didn't have an effect?
 

Deleted member 2897

Guest
This is definitely a case where you are looking for some piece of data that supports a claim instead of looking at data and arriving at a conclusion.

EDIT: It is also interesting that in your arguments, instead of answering questions and point in another direction. Social distancing isn't working ..... Who are you listening to? -- I am not listening to anyone I am looking at data. --- What data are you looking at? --- Well, you can see it in some places, but not others. -- What places? What data? -- Well, here is a single chart of the entire US(That doesn't separate places as you had specifically said your data did) -- That chart doesn't take into account differences in numbers of tests available, etc. -- Well I think this, I think that, you people don't know what you are talking about, etc. : You seem to be arguing a point without looking at anything other than what you believe to be true.

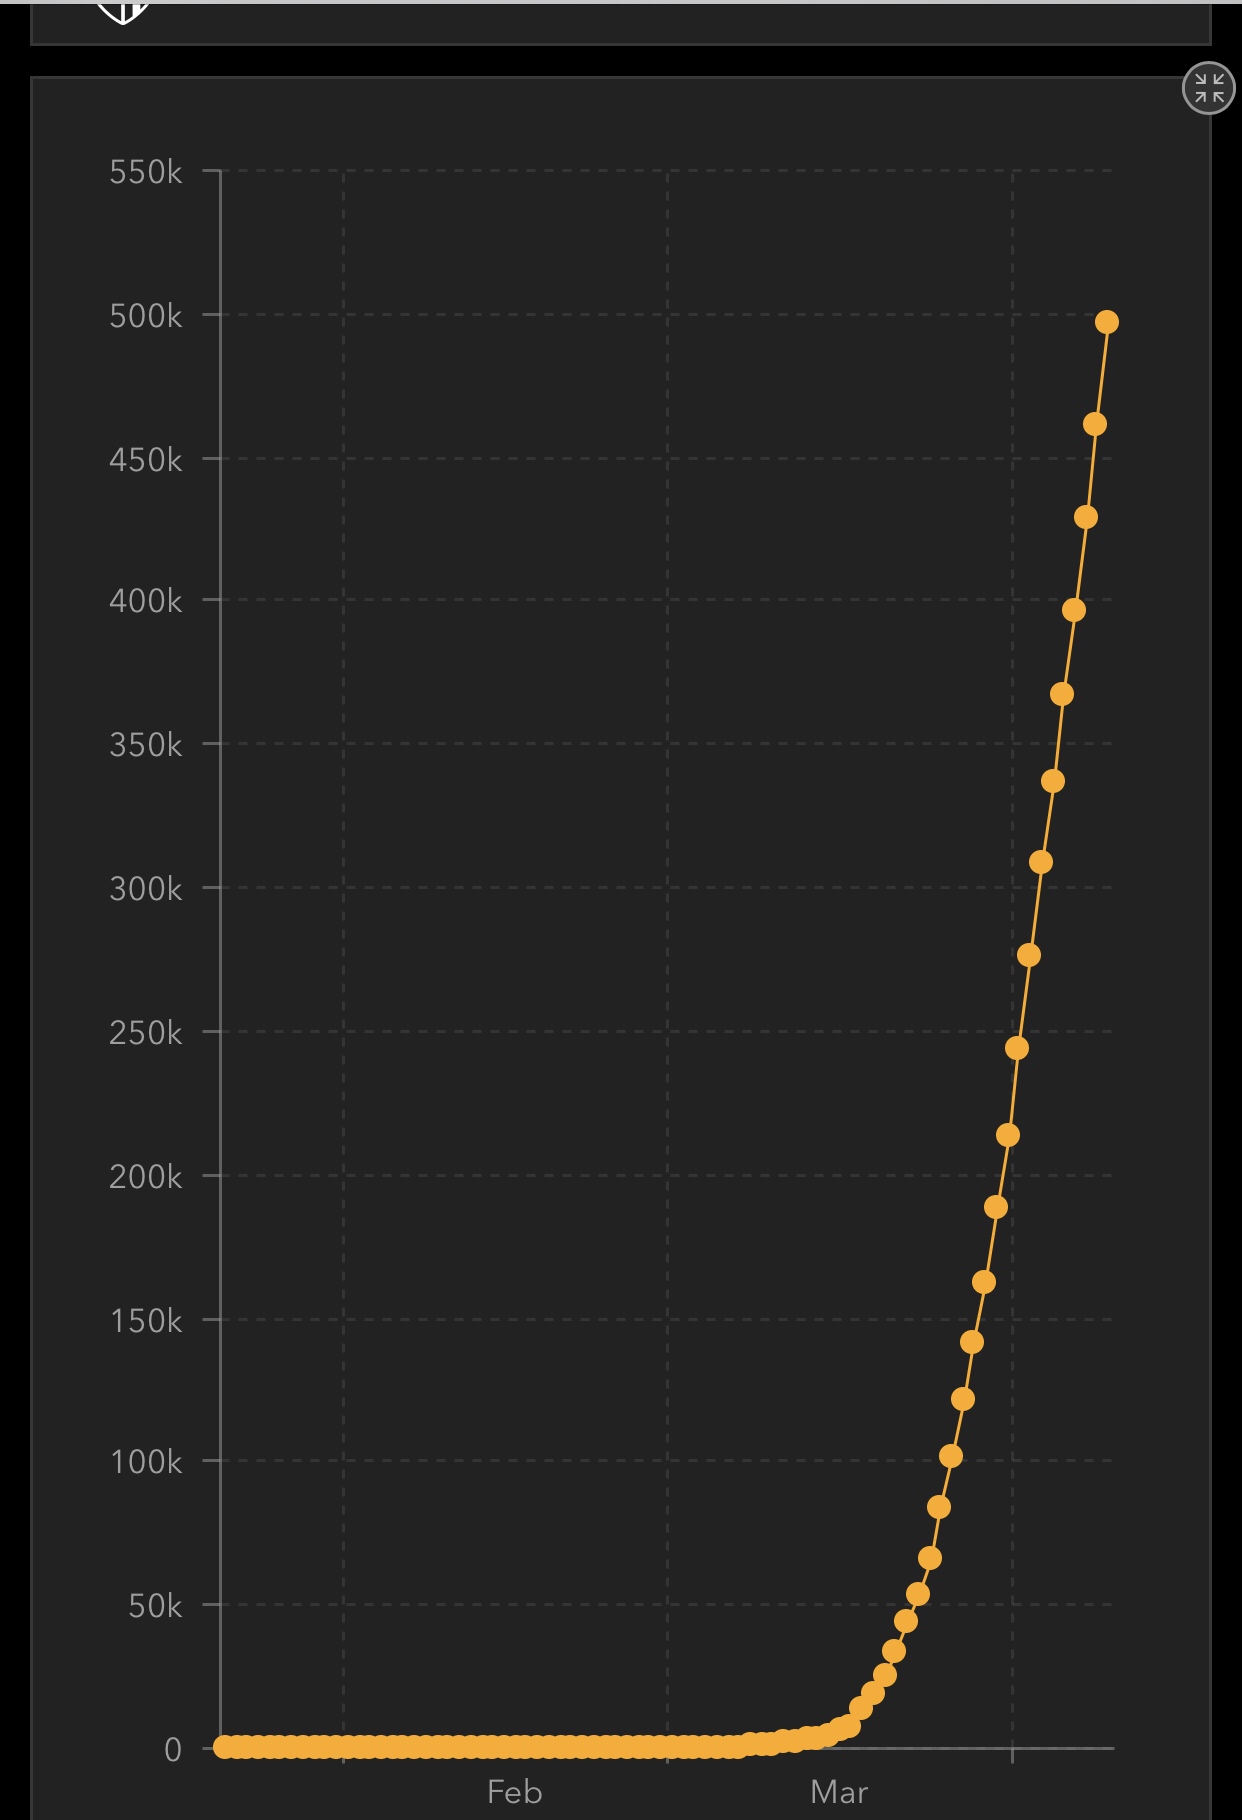
You’re acting foolish. Why? I showed you the data that shows our cases are still going up nationally just as much as they always have. The total test volume has plateaued and been consistent for quite a while now, so we’re not getting more cases simply because were testing more. I don’t have any narrative, I’m not trying to support my own bias. I’m just telling you what I’m seeing. If there’s anybody that has an ax to grind, your language says it all. I have no idea why you have such a bad attitude. Why can’t you just post links, ask questions, make statements, and disagree about things without being a jerk?
 

Deleted member 2897

Guest
What criteria are you using to say that social distancing didn't have an effect?

The fact we’ve been shut down for close to a month but cases are still increasing just as fast as they always have. 2-3 weeks ago we were seeing 15-20,000 new cases a day. Now we’re over 30,000/day. It makes no sense to me how that’s even possible.
 

LibertyTurns

Banned
Messages
6,216
Deaths in Florida were already plateauing before we put the stay at home order if effect. If you take out South NYC, the rest of the state is relatively benign.

If there’s anybody that has an ax to grind, your language says it all. I have no idea why you have such a bad attitude.
You seem to bring the best out of people! :D
 
Messages
13,443
Location
Augusta, GA
The fact we’ve been shut down for close to a month but cases are still increasing just as fast as they always have. 2-3 weeks ago we were seeing 15-20,000 new cases a day. Now we’re over 30,000/day. It makes no sense to me how that’s even possible.
Regardless, without a comparative study into what the effects would have been without social distancing (impossible to do), your conclusion is not a valid one.
 

RonJohn

Helluva Engineer
Messages
4,995
You’re acting foolish. Why? I showed you the data that shows our cases are still going up nationally just as much as they always have. The total test volume has plateaued and been consistent for quite a while now, so we’re not getting more cases simply because were testing more. I don’t have any narrative, I’m not trying to support my own bias. I’m just telling you what I’m seeing. If there’s anybody that has an ax to grind, your language says it all. I have no idea why you have such a bad attitude. Why can’t you just post links, ask questions, make statements, and disagree about things without being a jerk?

I have posted links, asked questions, made statements. I still have not seen replies to those questions.
 

Deleted member 2897

Guest
Regardless, without a comparative study into what the effects would have been without social distancing (impossible to do), your conclusion is not a valid one.

Think of it as more of a question. With relatively constant testing volume recently, and with wide scale social distancing, how are getting more cases today than we were before we even started?
 

Deleted member 2897

Guest
I have posted links, asked questions, made statements. I still have not seen replies to those questions.

You just recently asked 4 very similar questions about what data I was looking at, where, etc. I already posted the link and the chart. Then you made a bunch of rude comments, so honestly I don’t care about what you would like to know anymore. Maybe you can try a different tact the next time you have questions for someone.
 
Last edited by a moderator:

RonJohn

Helluva Engineer
Messages
4,995
Think of it as more of a question. With relatively constant testing volume recently, and with wide scale social distancing, how are getting more cases today than we were before we even started?

We started social distancing in late March when there were only about 30k-50k tests per day. We are between 2-4 weeks using social distancing. If this disease has a 2-14 day incubation period, an approx 5 day increase in symptoms, it will be 7-19 days before the number of detected cases actually levels out. That is what the predictions show. That is what the data is actually following. If you look at the IHME charts, (which I happened to post a link to earlier) and look at areas that implemented social distancing measures earlier, they are farther along on the curve slowing down. That includes New York who appears to be at their peak and about to decline.
 

Deleted member 2897

Guest
We started social distancing in late March when there were only about 30k-50k tests per day. We are between 2-4 weeks using social distancing. If this disease has a 2-14 day incubation period, an approx 5 day increase in symptoms, it will be 7-19 days before the number of detected cases actually levels out. That is what the predictions show. That is what the data is actually following. If you look at the IHME charts, (which I happened to post a link to earlier) and look at areas that implemented social distancing measures earlier, they are farther along on the curve slowing down. That includes New York who appears to be at their peak and about to decline.

New York didn’t issue stay at home orders until like March 22nd. They didn’t close parks and playgrounds until April. They were actually very slow.

So think about this one again: “We are between 2-4 weeks using social distancing. If this disease has a 2-14 day incubation period, an approx 5 day increase in symptoms, it will be 7-19 days before the number of detected cases actually levels out.”

We are 21 days into when the vast majority of the country had a stay at home order. Social distancing started even before that. 21 days >> 7-19 days. We’re an entire week past the midpoint, and 2 days past the high end limit, and we’re still seeing record increases in cases. Makes no sense to me.
 
Status
Not open for further replies.
Top