This is definitely a case where you are looking for some piece of data that supports a claim instead of looking at data and arriving at a conclusion.
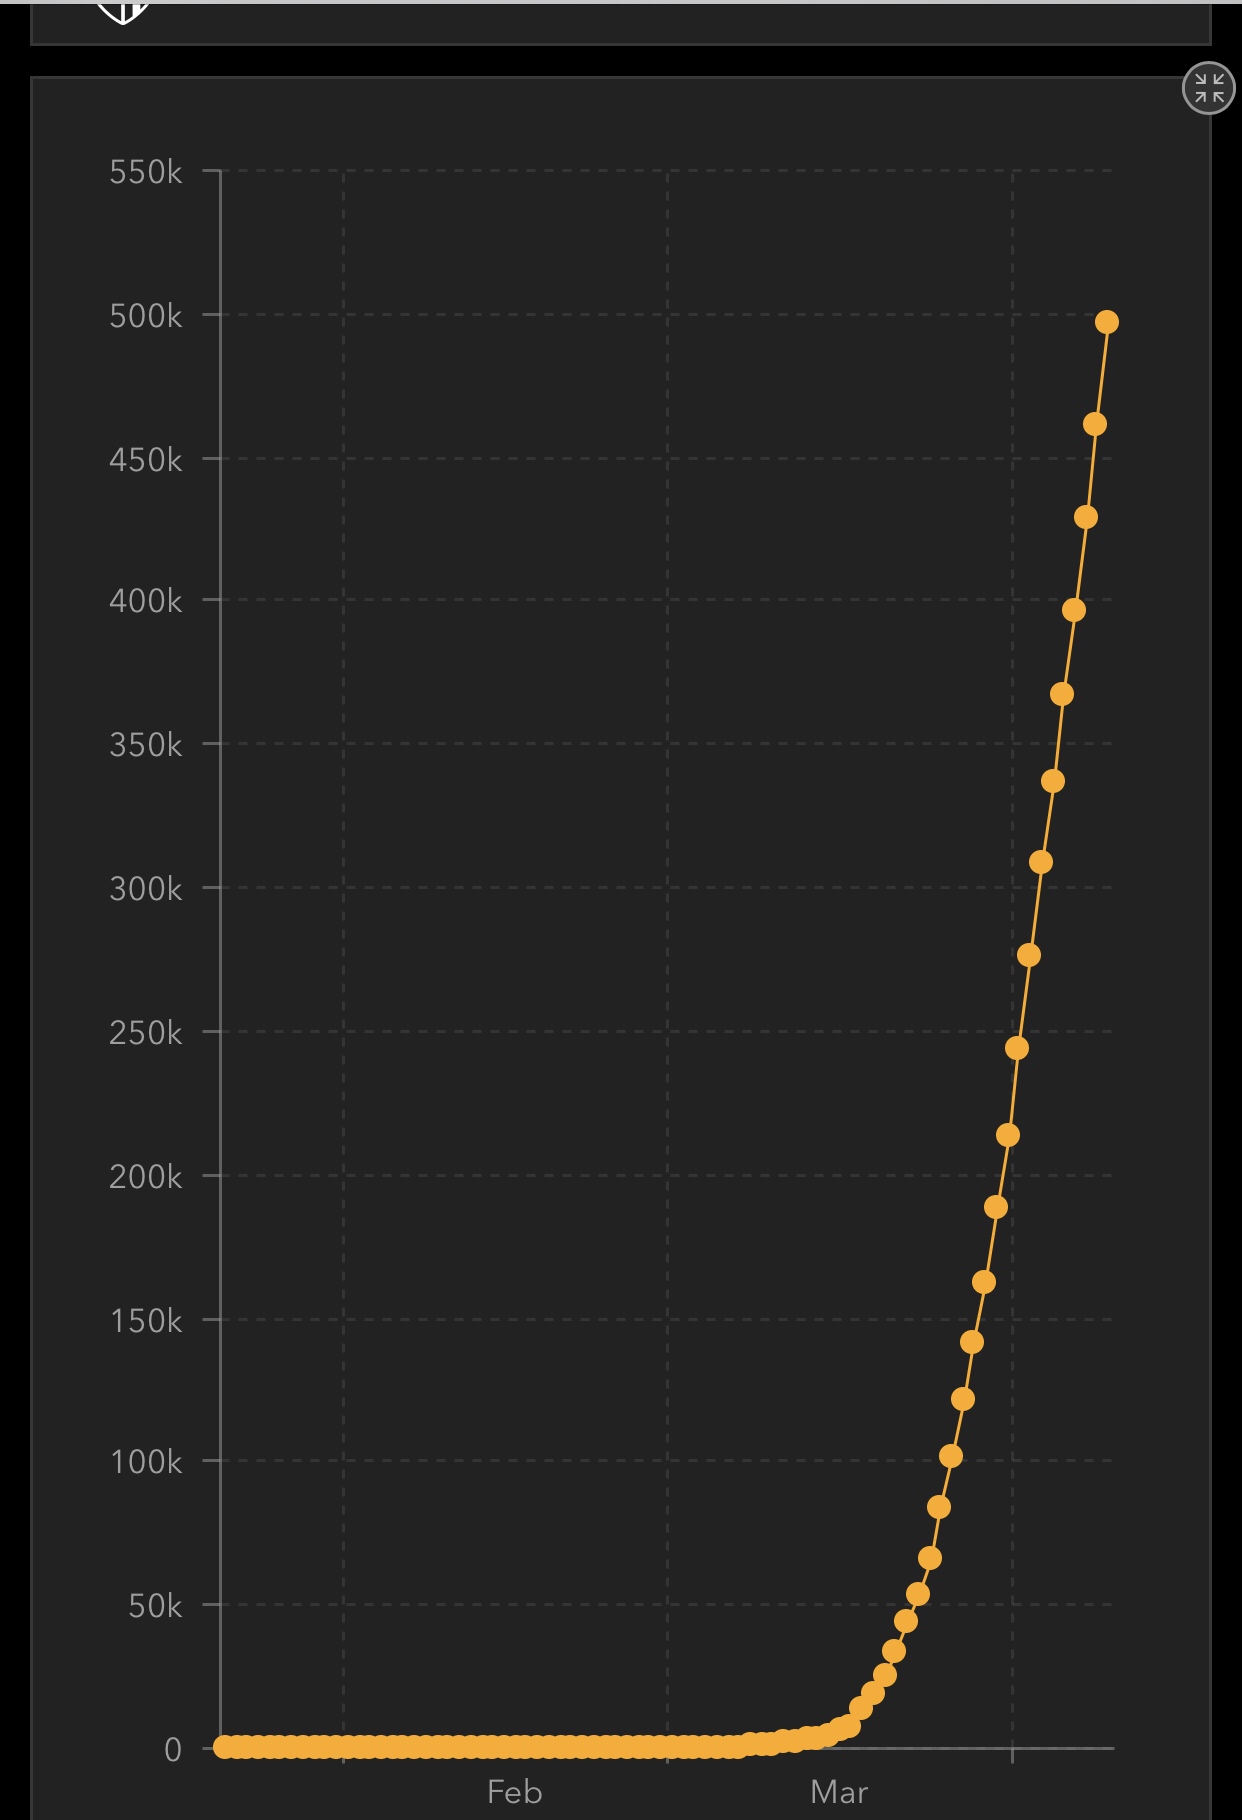
EDIT: It is also interesting that in your arguments, instead of answering questions and point in another direction. Social distancing isn't working ..... Who are you listening to? -- I am not listening to anyone I am looking at data. --- What data are you looking at? --- Well, you can see it in some places, but not others. -- What places? What data? -- Well, here is a single chart of the entire US(That doesn't separate places as you had specifically said your data did) -- That chart doesn't take into account differences in numbers of tests available, etc. -- Well I think this, I think that, you people don't know what you are talking about, etc. : You seem to be arguing a point without looking at anything other than what you believe to be true.