- Messages
- 10,066
- Location
- Williamsburg Virginia
One of the things we often talk about is how good a certain coach is or how good a certain GT team was and whether we ought to get a new coach or not. Putting aside the PR and money, I thought I’d look at just performance of the team.
To do that, I have a three part post. The first talks about Power Rankings and Strength of Schedule over the last 70 years, the second, what team performance has been over the last 70 years under coaches and third, what are the odds of getting better performance under another coach.
It is very difficult to compare teams since the sport of football has evolved so much. The typical way has been to compare win/loss records in a season. But that depends a lot on how good your opponents are in a certain year.
One way to compare teams over many different years is to look at their Power Rankings. Power Rankings take into account not only relative strength of the other team, but where the game was played and margin of victory. The home field advantage is worth about 6 to 7 percent increase in the likelihood of a win (about 3.9 points). So who and where you play as well as how convincingly you win make a difference. The J Howell Power Rankings ones are the ones I use since the database goes back to 1869 (http://www.jhowell.net/cf/cfindex.htm ).
A Power Ranking is a percentage which is the best estimate of how likely a team is to beat an average team that year on a neutral field. So last year, GT ended up with a Power Ranking of .642 which means that we had a 64.2% chance of beating last year’s average team on a neutral field. After the 2013 season, we were ranked 40th, so 39 teams had a higher Power Ranking. FSU had a 92.7% chance of beating that average team. So you get relative rankings that allow comparing teams in a certain year, and also the margin by which they dominated.
Calculating SOS is similar. It considers the Power Ranking and where you play. Every year, the average of all teams SOS is about .5 (50%) Here’s the chart of our SOS from the beginning of Bobby Dodd’s time till now. Our SOS has gotten progressively weaker. It was highest in the SEC, then went down as we became independent and finally decreased even more in the ACC.

Now realize that the SOS includes championship games (if any) and bowl games (if any). So if you win the ACCCG and go to the Orange bowl, your SOS is going to be higher. So this isn’t a pure reflection of our regular season lineup, but regular season and post season. That’s why 2009 was higher. And also why the Dodd teams of the 50’s where we were top 10 most of the time, resulted in high SOSs. Dodd played the toughest teams in the regular season and then had a tough bowl. For 2013, our SOS increased about 4% with the bowl game.
Another interesting thing is that in our 1990 National Championship year, we had a weak SOS (68.5%) for a national champion. It helped that others lost and there wasn’t the BCS. But it also gives hope to teams with weak SOS to be able to win the NC.
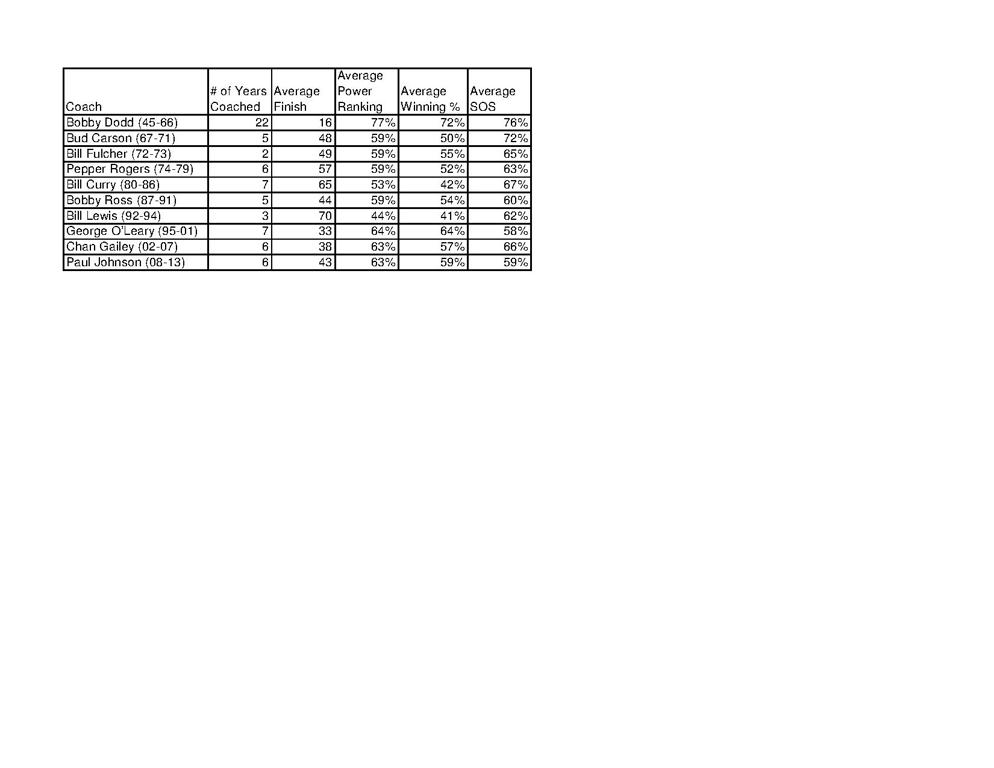
Finally here are the average SOS for our coaches in the last 70 years in the far right column where you can see how the average SOS has decreased steadily over the years with the exception of Curry and Gailey.

We are going to get a tougher SOS next year, since we basically replace Georgia Southern with Notre Dame. (Next year, the D2 cupcake hasn’t been determined.) Here’s our current (and likely to change) out of conference schedule
2014 08/30 vs Wofford, 09/06 at Tulane, 09/13 vs Georgia Southern, 11/29 at Georgia
2015 TBD, 09/12 vs Tulane, TBA at Notre Dame, 11/28 vs Georgia
2016 TDB, 09/03 vs Mercer, 09/17 vs Vanderbilt, 11/26 at Georgia
What are people's thoughts on the SOS we play?
