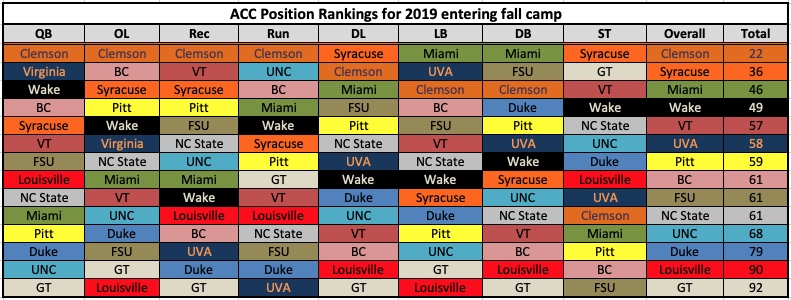
Can anyone actually understand what most these stats are measuring? RMT? T5? Looks like mumbo jumbo to me.
I think we are going to surprise all the "experts" pretty much across the board.
He gives the stat definitions in the bottom. %1DTD is percentage of catches for first downs or touchdowns. I think Pro Football Focus uses that stat. He’s looked at Red Zone Catchable Throw %—you’re a receiver, the field is jammed up and coverage is tighter, and the throw isn’t ten yards behind you.
The stats are decent stats. If it didn’t fit his eyeball test of what he’d seen the last couple of years, he’d probably tweak which ones he uses. But it’s not set up to be as predictive as what Bill Connelly has.
Keep in mind with stats that some teams are going to fluctuate a deviation above or below. Hale picked Syracuse near the bottom last year, and they played great.
That doesn’t mean that Hale is stupid. That means there are 14 teams, and even with the stats from last year, some are going to perform worse than expected and some are going to perform better. It would be surprising if everyone fell where they were slotted here.
How good was our pass coverage last year? Well, how safe did you feel on 3rd and 15? I felt like the other team had a really good shot at a first down.
Were we playing better at the end of the year than the beginning? I’d say we didn’t really progress during the year—we had a couple of wins towards the end, but it wasn’t the same as in the really solid years where you could see we were putting things together and playing as a team.
If you’re an outsider (like the sports books and the journalists), there’s plenty of objective reason not to expect a lot of wins.
I do have some optimism that we can be this year’s Syracuse. Someone always is.
Sent from my iPad using Tapatalk


