NOAA&NASA: 2014 Warmest Year on Record

cyptomcat

Ramblin' Wreck
Messages
866
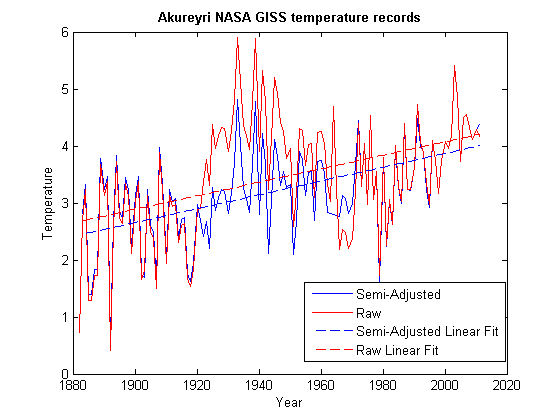
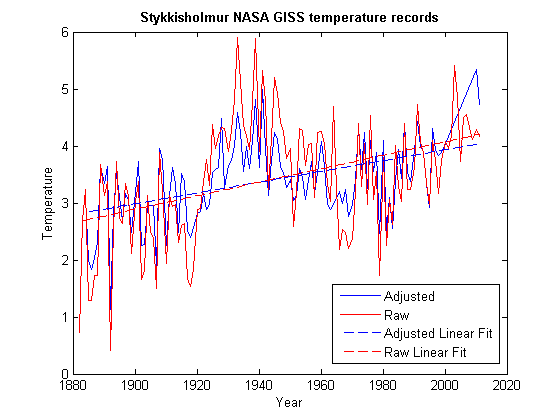
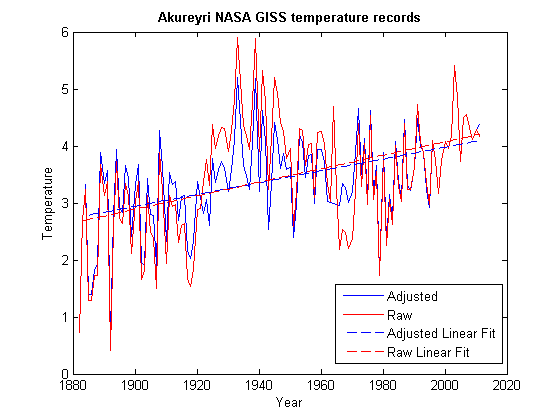
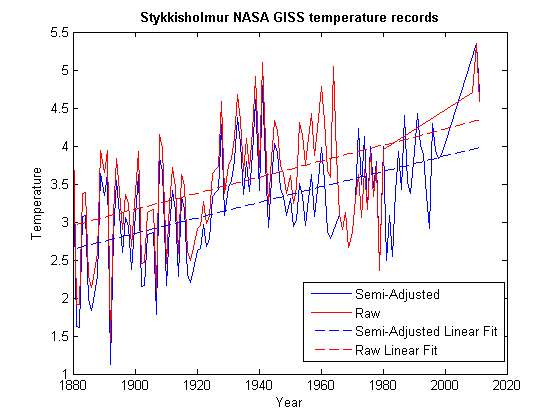
Here are the plots with the linear fits for Iceland stations with graphs in the article. They are not perfect, they could use some
cleaning up, but it's using the time frame for the available raw data. I didn't choose any of the ranges, Matlab did it automatically.

I called the adjusted data Homewood uses as 'semi-adjusted', because it hasn't gone through all the adjustments. What I call
'adjusted' is the data after all the adjustments (data used in OP post for example.)
Md3AZbt.png

zcF1i5s.png

bWY0IQJ.png

GHQ1Qlh.png
 

Northeast Stinger

Helluva Engineer
Messages
10,790
Here are the plots with the linear fits for Iceland stations with graphs in the article. They are not perfect, they could use some
cleaning up, but it's using the time frame for the available raw data. I didn't choose any of the ranges, Matlab did it automatically.

I called the adjusted data Homewood uses as 'semi-adjusted', because it hasn't gone through all the adjustments. What I call
'adjusted' is the data after all the adjustments (data used in OP post for example.)
Md3AZbt.png

zcF1i5s.png

bWY0IQJ.png

GHQ1Qlh.png
To the layman what becomes readily apparent is that all four ways of plotting this graph show an upward trajectory. Are there any ways to plot this that show a downward trajectory? The only reason I ask is that I still run across the outlier position when surfing the web of the person who says the earth has been gradually getting cooler. More commonly, I have heard this from certain U.S. Congressmen who claim to be quoting reputable science.
 

cyptomcat

Ramblin' Wreck
Messages
866
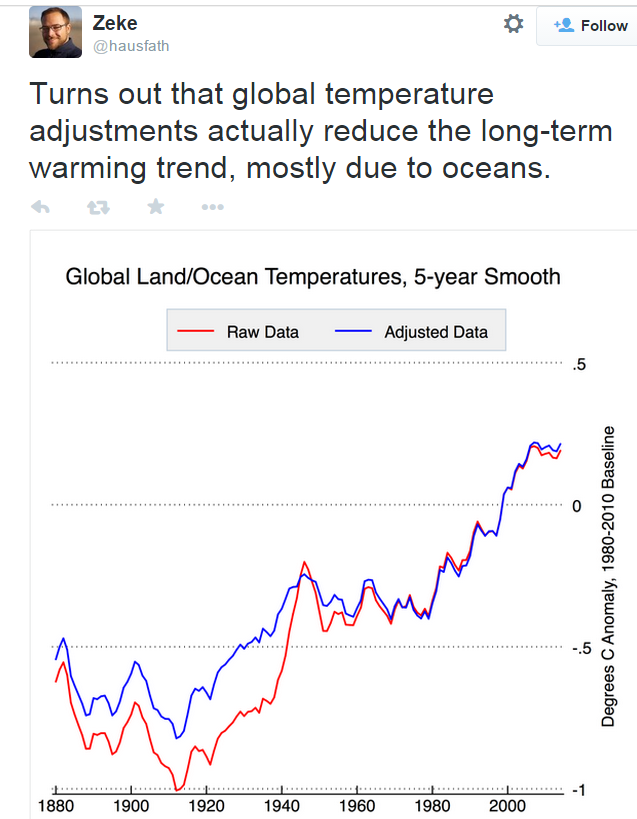
Looks like Hausfather did what I was asking Homewood to do. He looked into the overall effect of the adjustments using the HadSST3 and GHCNv3 datasets. He found that past global average is not made cooler, but in fact warmer through the adjustments.

HBlBc1S.png
 

AE 87

Helluva Engineer
Messages
13,026
Looks like Hausfather did what I was asking Homewood to do. He looked into the overall effect of the adjustments using the HadSST3 and GHCNv3 datasets. He found that past global average is not made cooler, but in fact warmer through the adjustments.

HBlBc1S.png


It would be nice if these guys would talk with each other about the data rather than just making assertions of data that supports their points. At this point, people who are sympathetic one side or the other will just accept that they're getting the straight scoop from their guy and the guy on the other side is stupid or evil.
 

AE 87

Helluva Engineer
Messages
13,026
@cyptomcat , Hausfather also retweeted this:

"

Here, the red line and blue line look relatively comparable to those on the graph you referenced; however, on this graph, the blue line is labelled, "No Breakpoint Adjustments", which seems like Raw data to me, and the blue line is labelled, "Metadata and Empirical Breakpoints," seems to include two sets of adjustments.

I notice that the y-axis differs from a 1901 to 2000 baseline for this graph and a 1980 to 2010 baseline for the one you embedded, but I reckon that shouldn't affect the relationship between raw and adjusted.

So, it seems like two different stories. I'm sure that I'm missing something simple, so could you help-out my tired mind?
 

cyptomcat

Ramblin' Wreck
Messages
866
@cyptomcat , Hausfather also retweeted this:

"

Here, the red line and blue line look relatively comparable to those on the graph you referenced; however, on this graph, the blue line is labelled, "No Breakpoint Adjustments", which seems like Raw data to me, and the blue line is labelled, "Metadata and Empirical Breakpoints," seems to include two sets of adjustments.

I notice that the y-axis differs from a 1901 to 2000 baseline for this graph and a 1980 to 2010 baseline for the one you embedded, but I reckon that shouldn't affect the relationship between raw and adjusted.

So, it seems like two different stories. I'm sure that I'm missing something simple, so could you help-out my tired mind?

Berkeley Earth is independent from NASA in terms of processing.

In the figure I posted, he plotted NASA's raw and adjusted. In yours, he is plotting Berkeley Earth's raw and adjusted.

Adjustment algorithms are different between the two, and Berkeley Earth uses more stations than NASA. That's because NASA (maybe also NOAA) don't see some stations as reliable enough.

I posted the previous one, because Homewood's claim was about NASA's adjustment algorithms.
 

00Burdell

Helluva Engineer
Messages
1,298
Location
Parts Unknown
At this point, people who are sympathetic one side or the other will just accept that they're getting the straight scoop from their guy and the guy on the other side is stupid or evil.

Well put. Which is exactly why this debate is a waste of time. Like two religious factions trying to convince each other which side owns the truth.

When the conclusion precedes the results, the argument is over.
 

AE 87

Helluva Engineer
Messages
13,026
Berkeley Earth is independent from NASA in terms of processing.

In the figure I posted, he plotted NASA's raw and adjusted. In yours, he is plotting Berkeley Earth's raw and adjusted.

Adjustment algorithms are different between the two, and Berkeley Earth uses more stations than NASA. That's because NASA (maybe also NOAA) don't see some stations as reliable enough.

I posted the previous one, because Homewood's claim was about NASA's adjustment algorithms.

Again, I may not be following rightly. Are you saying that there is so much raw temperature measurement available from 1880 to 1950 that Berkeley chose some which had to be modified down and the data chosen by NASA had to be modified up?
 

cyptomcat

Ramblin' Wreck
Messages
866
Again, I may not be following rightly. Are you saying that there is so much raw temperature measurement available from 1880 to 1950 that Berkeley chose some which had to be modified down and the data chosen by NASA had to be modified up?
It's a combination of more data and different algorithms. They have probably looked at effect sizes in their papers, but I haven't read them. All of this stuff is public though. I think it's NASA that chooses some of the stations, whereas Berkeley uses all the stations. Something like 5 times as many stations IIRC.
 
Last edited:

collegeballfan

Helluva Engineer
Messages
1,694
Carbon dioxide levels at Mauna Loa Observatory, NOAA/Earth System Research Laboratory in June of stated year in parts per million.
1958 314.85
1968 325.36
1978 337.98
1988 353.64
1998 368.78
2008 387.88
2014 398.81

Do you have the ability to detect a trend? Do you know the effect of carbon dioxide on the atmosphere?
 

cyptomcat

Ramblin' Wreck
Messages
866
Carbon dioxide levels at Mauna Loa Observatory, NOAA/Earth System Research Laboratory in June of stated year in parts per million.
1958 314.85
1968 325.36
1978 337.98
1988 353.64
1998 368.78
2008 387.88
2014 398.81

Do you have the ability to detect a trend? Do you know the effect of carbon dioxide on the atmosphere?
IMO something not discussed much is how CO2 holds water in atmosphere, regardless of the warming effect, more water in atmosphere would have an effect on storms and especially amount of precipitation (summer or winter).

I think this would be a good start for a new thread, but let's keep this one specific on measuring temperatures. There has been a lot to discuss just about that.
 

cyptomcat

Ramblin' Wreck
Messages
866
Curry actually had couple more guest posts on adjusted temperature records that we discussed in detail in this thread:
http://judithcurry.com/2015/02/22/understanding-time-of-observation-bias/
http://judithcurry.com/2015/02/09/berkeley-earth-raw-versus-adjusted-temperature-data/

I think she is trying to clear the channel on the confusion about temperature records, and IMO Hausfather has been doing a good job explaining the temperature records and IMO deservingly got to write on Curry's blog 3 times now.
 
Top