Stats models and rankings

slugboy

Moderator
Staff member
Messages
10,809
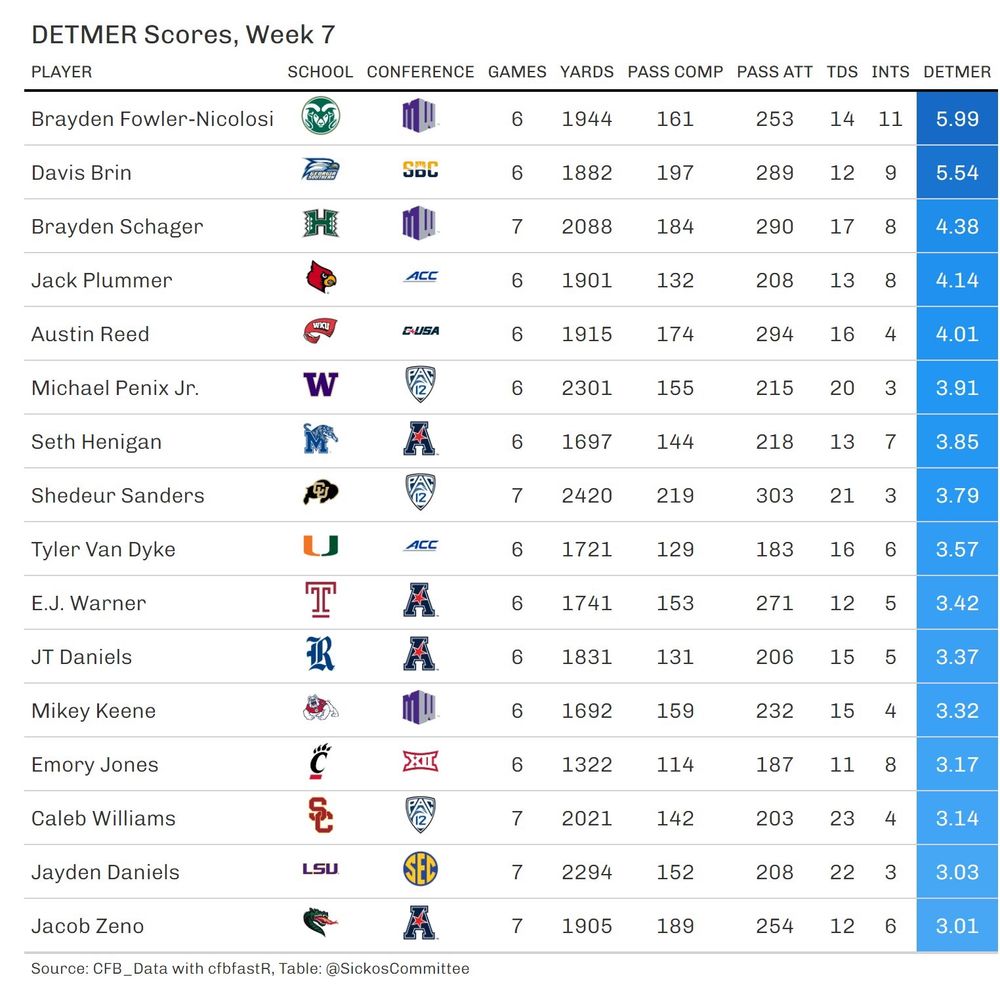
Fresh off the presses (sickos committee social media)


33e17612-c9c2-42f8-8912-d594308720ef.jpg
 

CEB

Helluva Engineer
Messages
2,150
The one caveat for me is, if you were predicting a game and you had two teams playing each other and both have 4 OPPD and 1 DPPD, how do you predict a winner? At that point you need *something* else, whether than be some SOS based metric, some yardage based metric, a coin flip.

Put ‘em on the field and snap it!
IMG_7354.jpg
 

kittysniper101

Jolly Good Fellow
Messages
166
I'll buy most of this. However, if your advantage derives from longer possessions, then you should indeed shorten the game, especially if your D is doubtful. A team I can't remember did this for over a decade. Rats! It's right on the top of my tongue! Give me a minute!
You raise a good point. At some point if you do something so fundamentally different than the rest of football what analytics should you follow and which should you ignore? Certainly our best years with the 3O were when we had options to be explosive (often in the passing game). On the other hand, I don’t think anyone is saying we’d have been more successful if we followed the “running on 2nd and long is the worst thing you can do” advice that permeates the NFL and NCAA analytics.
 

iceeater1969

Helluva Engineer
Messages
8,961
6 games.
Rough stats Gt and Duke
Gt
200 rush attempts for about 900 yds
150 pass attempts for 1600 yds.

Duke
200 rush attempts for about 1200 yds

150 pass attempts for about 1200 yds.

Offense about the same.

Clear difference is Defense Duke is a darling of ACC talking heads and we are the middle of the pack.

Second half season lets hope our defense looks better.
 

ibeattetris

Helluva Engineer
Messages
3,554
BCFToys front page has a chart showing the average drive data since 2007. This has existed for a while, but I usually just skip past it on my way to looking for specific data.
I looked a little closer today and saw some interesting things:
1698267834034.png


So the first is that PPD was just overall lower than I thought it was. I guess I became infatuated with the PPD stat during he CPJ era and just am so accustomed to numbers in the >2.8 range that I didn't think about average.

The second is the rise in the percentage of drives ending in "downs" beginning in 2018. PPD definitely has increased as teams have been going for it more, but I think there might be a ratio that can be improved to optimize it. One thing I definitely think about the analytics surrounding 4th down go/no go is that analytics are driven based on some factor of percent chance to get the conversion combined with the epa diff of each action. The one thing I think that is missing is in game success rate metrics along with the fact that neither the defense or offense seems to run normal offense in these scenarios. Anyways, my guess is that current analytic engines are overestimating 4th down conversion rates, but that is just my guess.

One interesting thing is teams seem to be more pass happy than in the past, but percent of drives ending in INT has dropped over the years.
 

stinger78

Helluva Engineer
Messages
1,995
BCFToys front page has a chart showing the average drive data since 2007. This has existed for a while, but I usually just skip past it on my way to looking for specific data.
I looked a little closer today and saw some interesting things:
View attachment 14957

So the first is that PPD was just overall lower than I thought it was. I guess I became infatuated with the PPD stat during he CPJ era and just am so accustomed to numbers in the >2.8 range that I didn't think about average.

The second is the rise in the percentage of drives ending in "downs" beginning in 2018. PPD definitely has increased as teams have been going for it more, but I think there might be a ratio that can be improved to optimize it. One thing I definitely think about the analytics surrounding 4th down go/no go is that analytics are driven based on some factor of percent chance to get the conversion combined with the epa diff of each action. The one thing I think that is missing is in game success rate metrics along with the fact that neither the defense or offense seems to run normal offense in these scenarios. Anyways, my guess is that current analytic engines are overestimating 4th down conversion rates, but that is just my guess.

One interesting thing is teams seem to be more pass happy than in the past, but percent of drives ending in INT has dropped over the years.
Good stuff.
 

stinger78

Helluva Engineer
Messages
1,995
We’ve been a hoot this season

From Bill Connelly:

"Over the past five games, Georgia Tech has overachieved against SP+ projections by 28.6 points, underachieved by 29.7, overachieved by 26.9, underachieved by 24.4 and overachieved by 16.7."

(Seen on Reddit)
So what do you take from that? IMPO, when I have an intern or new, inexperienced hire, I expect initially a lot of screwups and me having to fix things. I expect, as he/she gains proficiency that I will see more successes mixed in among the screwups. Finally, as the person gains proficiency, I expect to see fewer and fewer screwups an sustained success.

Applying that paradigm to this team tells me 50% progress is being made and I should expect screwups to decrease in short order. Being as the season is now 2/3 over, that may be next fall, but I’d look back at this year as a successful growth year.
 

CuseJacket

Administrator
Staff member
Messages
18,963
So what do you take from that? IMPO, when I have an intern or new, inexperienced hire, I expect initially a lot of screwups and me having to fix things. I expect, as he/she gains proficiency that I will see more successes mixed in among the screwups. Finally, as the person gains proficiency, I expect to see fewer and fewer screwups an sustained success.

Applying that paradigm to this team tells me 50% progress is being made and I should expect screwups to decrease in short order. Being as the season is now 2/3 over, that may be next fall, but I’d look back at this year as a successful growth year.
The alternative is a team like Syracuse... whip the cupcakes and then get whipped by anyone with a pulse (thus far).

I'm with you in that there is a lot more reason for optimism based on our Jekyll and Hyde performance this year.
 

ibeattetris

Helluva Engineer
Messages
3,554
BCFToys updated game data for UNC yesterday: https://www.bcftoys.com/2023-gr/#georgia-tech
Offense:
1698775017993.png

Defense
1698775040439.png


Truly we honored CPJ on Saturday by having one of his classic "no defense takes the field" kind of game.

In terms of pure PPD, we coupled our best performance of the year with our third worst on defense. Good timing.

Funny enough, in terms of defense yardage, it was our highest yards given up. Due to the number of drives though, it was only the third worst in terms of DAY. Despite only giving up 364 to Bowling Green, that game was worse giving up 66.4% of availavle yards compared to 62.1% against UNC.
 

stinger78

Helluva Engineer
Messages
1,995
Jackets are now #18 in Total Offense at 459.2 ypg. We've scored 33 offensive TD's. The only team left on our schedule that's ahead of us is UGAg. That'll be a tough game.

Defensively, well, we need mo offense! :p
 
Top