cyptomcat
Ramblin' Wreck
- Messages
- 866
NASA Slides: http://www.nasa.gov/sites/default/files/atoms/files/noaa_nasa_global_analysis_2015.pdf
NASA release: http://www.nasa.gov/press-release/n...d-shattering-global-warm-temperatures-in-2015

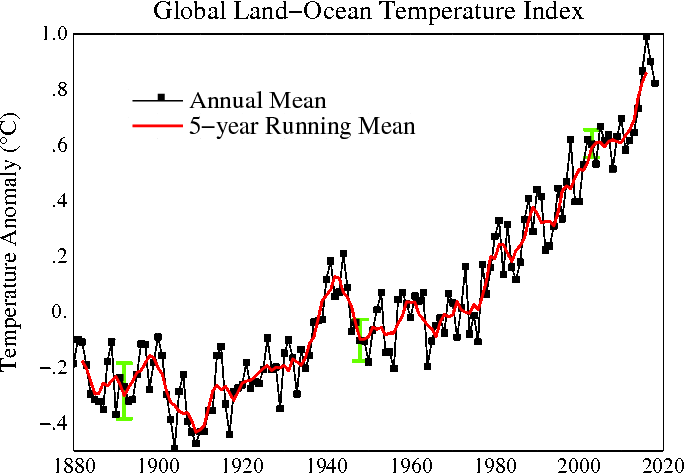
"Line plot of global mean land-ocean temperature index, 1880 to present, with the base period 1951-1980. The dotted black line is the annual mean and the solid red line is the five-year mean. The green bars show uncertainty estimates."
link for graph: http://data.giss.nasa.gov/gistemp/graphs_v3/
There is also a researcher that updates on how the IPCC AR5 temperature predictions fare with the real temperatures. His most recent graph:

link: http://www.climate-lab-book.ac.uk/comparing-cmip5-observations/
NASA release: http://www.nasa.gov/press-release/n...d-shattering-global-warm-temperatures-in-2015

"Line plot of global mean land-ocean temperature index, 1880 to present, with the base period 1951-1980. The dotted black line is the annual mean and the solid red line is the five-year mean. The green bars show uncertainty estimates."
link for graph: http://data.giss.nasa.gov/gistemp/graphs_v3/
There is also a researcher that updates on how the IPCC AR5 temperature predictions fare with the real temperatures. His most recent graph:

link: http://www.climate-lab-book.ac.uk/comparing-cmip5-observations/
