115 Years of GT Football – A New Chapter

GTNavyNuke

Helluva Engineer
Featured Member
Messages
10,056
Location
Williamsburg Virginia
I’ve done posts the last five years about the history of GT football. Last year’s post was at https://gtswarm.com/threads/114-years-of-gt-football-–-how-will-history-repeat.15192/

I arbitrarily say 115 years since 1904 was Heisman’s first year. He was our first real coach and between 1892 and 1904 we either had no coach or a teacher as coach.

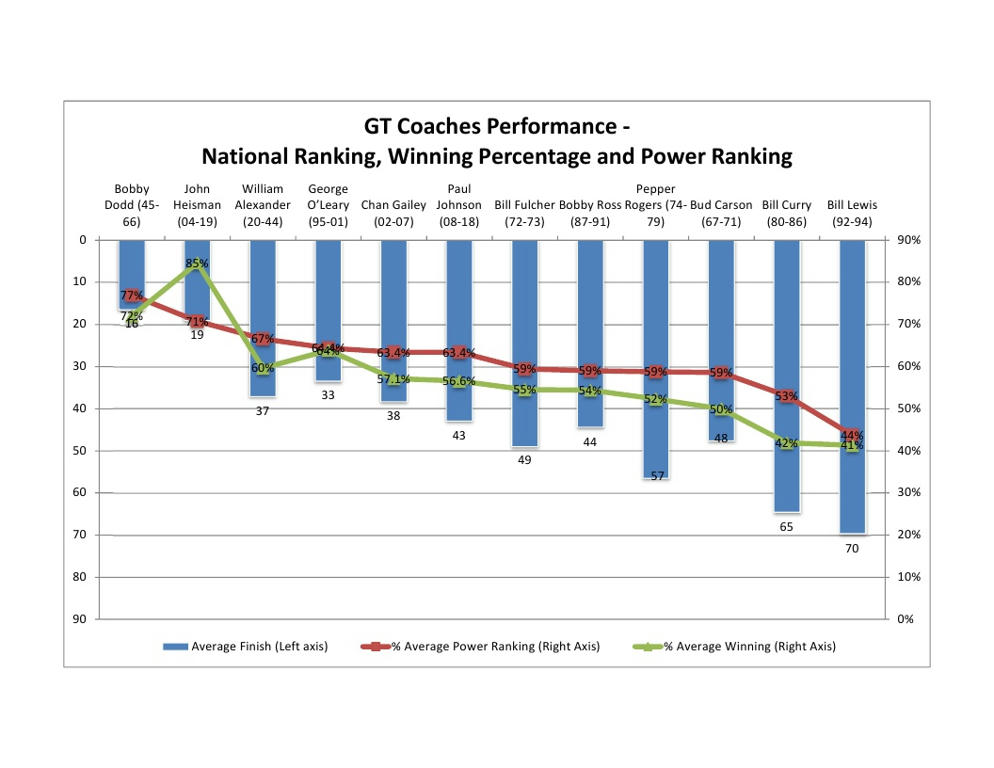
Here’s a graph that shows three things. First in red line, the average JHowell Power Ranking for that coach*. Next in green line the average winning % for that coach. And finally, in the blue bar, the average yearly JHowell ranking finish for that coach. (More on JHowell at http://www.jhowell.net/cf/cfindex.htm ) Bobby Dodd was far and away the best and Bill Lewis the worst. Heisman came in a “respectable” second.
tqjtyuo0e9mhpj66g.jpg


Johnson’s performance is right there with Gailey and below O’Leary. CPJ and Gailey have the same average Power Ranking but Gailey was slightly better in average in team ranking at the end of the year and in Average Winning %. Note I’m talking about performance when comparing coaches and not whether one coach would be better than another in today’s environment including money and recruiting and scholastics and all that. All of these rankings are based on their peers at the time. These are just the facts from an unbiased source.

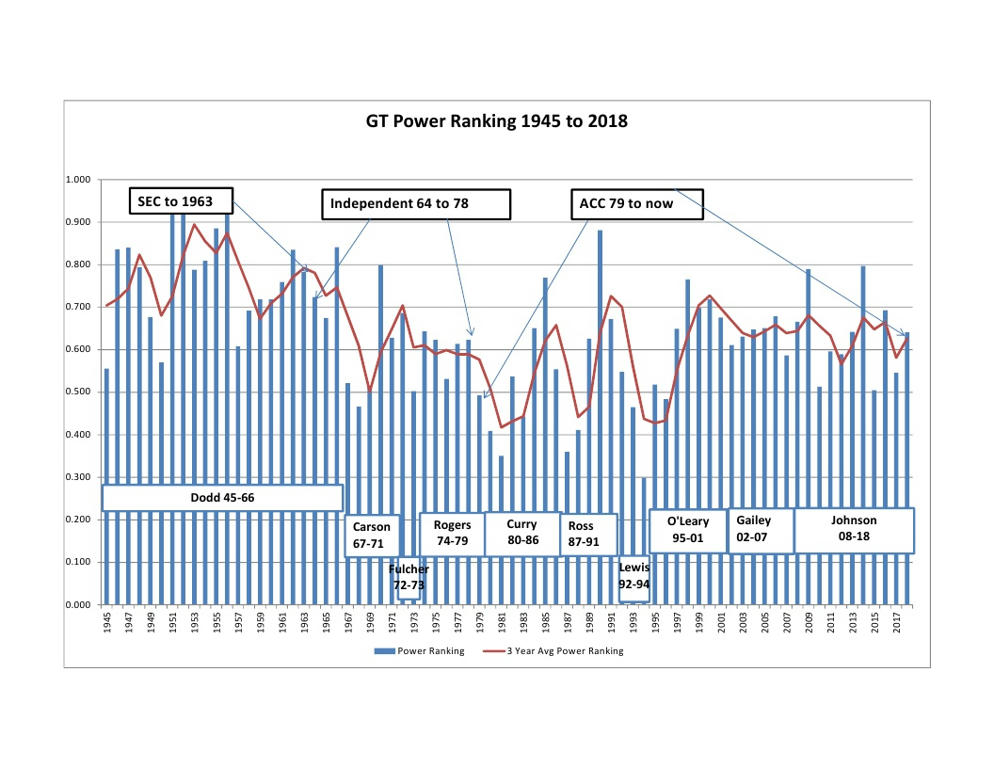
And here are the yearly Power Ranking results that make up the averages above. Our 2018 final Power Ranking of 63.4% meant that we had a 63.4% chance of beating an average team on a neutral field.
40u5zhgdbxgi0fi6g.jpg


*I like the Power Ranking metric the best – they reflect Strength of Schedule. This has the discussion why https://gtswarm.com/threads/70-years-of-gt-football-–-strength-of-schedule.2489/
 

Attachments

  • 2018 115 Years GT Coaches Performance.pdf
    523.7 KB · Views: 8
  • 2018 115 Years Yearly Performance.pdf
    417.8 KB · Views: 8

GTNavyNuke

Helluva Engineer
Featured Member
Messages
10,056
Location
Williamsburg Virginia
Everyone is guessing how we are going to do this year. After carefully studying the data, I can guarantee we are going to do better than Bill Curry’s first year 9% winning %(1-9-1) and worse than William Alexander’s 89% (8-1-0). Best to worse % winning first year:

William Alexander (20-44) 89%
John Heisman (04-19) 80%
Paul Johnson (08-18) 69%
Bill Fulcher (72-73) 58%
Pepper Rogers (74-79) 55%
Chan Gailey (02-07) 54%
Bill Lewis (92-94) 45%
Bobby Dodd (45-66) 40%
Bud Carson (67-71) 40%
Bobby Ross (87-91) 18%
Bill Curry (80-86) 9%

One silver lining in the data is Bobby Dodd’s first year at 40%.

Based on this data, I’m guessing we do about average for a first year coach and go 7-6 or 54%. I do know this year is a lot more interesting since so there is so much more publicly displayed energy and emphasis on public relations.
 

takethepoints

Helluva Engineer
Messages
6,086
I’ve done posts the last five years about the history of GT football. Last year’s post was at https://gtswarm.com/threads/114-years-of-gt-football-–-how-will-history-repeat.15192/

I arbitrarily say 115 years since 1904 was Heisman’s first year. He was our first real coach and between 1892 and 1904 we either had no coach or a teacher as coach.

Here’s a graph that shows three things. First in red line, the average JHowell Power Ranking for that coach*. Next in green line the average winning % for that coach. And finally, in the blue bar, the average yearly JHowell ranking finish for that coach. (More on JHowell at http://www.jhowell.net/cf/cfindex.htm ) Bobby Dodd was far and away the best and Bill Lewis the worst. Heisman came in a “respectable” second.

tqjtyuo0e9mhpj66g.jpg


Johnson’s performance is right there with Gailey and below O’Leary. CPJ and Gailey have the same average Power Ranking but Gailey was slightly better in average in team ranking at the end of the year and in Average Winning %. Note I’m talking about performance when comparing coaches and not whether one coach would be better than another in today’s environment including money and recruiting and scholastics and all that. All of these rankings are based on their peers at the time. These are just the facts from an unbiased source.

And here are the yearly Power Ranking results that make up the averages above. Our 2018 final Power Ranking of 63.4% meant that we had a 63.4% chance of beating an average team on a neutral field.
40u5zhgdbxgi0fi6g.jpg


*I like the Power Ranking metric the best – they reflect Strength of Schedule. This has the discussion why https://gtswarm.com/threads/70-years-of-gt-football-–-strength-of-schedule.2489/
Very impressive. Glad you used moving averages for the trends. Wish everyone here (I'm to blame myself) used those; we'd get a much clearer picture of what's going on.
 

jacketup

Helluva Engineer
Messages
1,551
I’ve done posts the last five years about the history of GT football. Last year’s post was at https://gtswarm.com/threads/114-years-of-gt-football-–-how-will-history-repeat.15192/

I arbitrarily say 115 years since 1904 was Heisman’s first year. He was our first real coach and between 1892 and 1904 we either had no coach or a teacher as coach.

Here’s a graph that shows three things. First in red line, the average JHowell Power Ranking for that coach*. Next in green line the average winning % for that coach. And finally, in the blue bar, the average yearly JHowell ranking finish for that coach. (More on JHowell at http://www.jhowell.net/cf/cfindex.htm ) Bobby Dodd was far and away the best and Bill Lewis the worst. Heisman came in a “respectable” second.

tqjtyuo0e9mhpj66g.jpg


Johnson’s performance is right there with Gailey and below O’Leary. CPJ and Gailey have the same average Power Ranking but Gailey was slightly better in average in team ranking at the end of the year and in Average Winning %. Note I’m talking about performance when comparing coaches and not whether one coach would be better than another in today’s environment including money and recruiting and scholastics and all that. All of these rankings are based on their peers at the time. These are just the facts from an unbiased source.

And here are the yearly Power Ranking results that make up the averages above. Our 2018 final Power Ranking of 63.4% meant that we had a 63.4% chance of beating an average team on a neutral field.
40u5zhgdbxgi0fi6g.jpg


*I like the Power Ranking metric the best – they reflect Strength of Schedule. This has the discussion why https://gtswarm.com/threads/70-years-of-gt-football-–-strength-of-schedule.2489/


Meaningless. Curry walked into a mess after Pepper and after terrible AD leadership. O'Leary walked in after the Lewis mess. These stats penalize them for the prior coach's failures.

Recruiting and changing a culture may be the most important thing a coach does. This information ignores the rebuilding process.

Run these stats beginning with the third year of the coach's tenure, eliminate FBS/I-AA opponents, and you will get very different results. You will also get a more accurate picture of the coach's ability.
 

TheSilasSonRising

Helluva Engineer
Messages
3,729
Meaningless. Curry walked into a mess after Pepper and after terrible AD leadership. O'Leary walked in after the Lewis mess. These stats penalize them for the prior coach's failures.

Recruiting and changing a culture may be the most important thing a coach does. This information ignores the rebuilding process.

Run these stats beginning with the third year of the coach's tenure, eliminate FBS/I-AA opponents, and you will get very different results. You will also get a more accurate picture of the coach's ability.

No way we should let curry off the hook for furman x 2
 

LibertyTurns

Banned
Messages
6,216
No way we should let curry off the hook for furman x 2
People only want to asterisk what they want to paint the picture they want to see. Each of these coaches were big boys when they were hired. They had their chance to build the program into what they wanted it to be and achieved the level of success they achieved. The results speak for themselves. It’s remarkably consistent.

Everybody seems to forget the ACC was FSU and everyone else for 12 of the first 14 years they were in conference. It was one weak *** conference in the 80’s and 90’s save maybe a year here and there.
 

takethepoints

Helluva Engineer
Messages
6,086
Meaningless. Curry walked into a mess after Pepper and after terrible AD leadership. O'Leary walked in after the Lewis mess. These stats penalize them for the prior coach's failures.

Recruiting and changing a culture may be the most important thing a coach does. This information ignores the rebuilding process.

Run these stats beginning with the third year of the coach's tenure, eliminate FBS/I-AA opponents, and you will get very different results. You will also get a more accurate picture of the coach's ability.
As I pointed out in another thread, there's nothing that makes statistics more gratifying then cherry-picking. The usual way to compare coaches is by their overall records for all years. What you are saying is that we have to be real careful about that.

Ok, do the analysis you suggest and come back to see us. Until you do there doesn't seem to be much reason to take you seriously. I might add that you will have to adjust opponents across eras to make the comparisons valid. When I first started watching Tech football back in the late 50s, Tulane was a tough game.
 

iceeater1969

Helluva Engineer
Messages
9,628
Navy, can you look at 2015 and show how it gets a .5 power factor.
I went to every home game and ND.
The guys fought hard but we lost every to every non crummy team except fsu whom we beat using up a miracle. We literally lost every game. The .5 ( we have a 50% chance if beating an average team) rating seems like a stretch.
 

GTNavyNuke

Helluva Engineer
Featured Member
Messages
10,056
Location
Williamsburg Virginia
Navy, can you look at 2015 and show how it gets a .5 power factor.
I went to every home game and ND.
The guys fought hard but we lost every to every non crummy team except fsu whom we beat using up a miracle. We literally lost every game. The .5 ( we have a 50% chance if beating an average team) rating seems like a stretch.

Ice, no problem. The .505 Power Factor is from a 3-9 record. Power Factor is based on wins/losses as well as SoS and home/away. But you have to win the games to get much credit at all (baseball gives a lot more credit for losses in their RPI).

You are right that we played really good teams away that year: the Strength of Schedule was .712 and that is without a bowl game which raises the SoS.
 

GTNavyNuke

Helluva Engineer
Featured Member
Messages
10,056
Location
Williamsburg Virginia
Meaningless. Curry walked into a mess after Pepper and after terrible AD leadership. O'Leary walked in after the Lewis mess. These stats penalize them for the prior coach's failures.

Recruiting and changing a culture may be the most important thing a coach does. This information ignores the rebuilding process.

Run these stats beginning with the third year of the coach's tenure, eliminate FBS/I-AA opponents, and you will get very different results. You will also get a more accurate picture of the coach's ability.

I'd love to see that for the last 115 years.
 

knoxjacket

Ramblin' Wreck
Messages
855
Everybody seems to forget the ACC was FSU and everyone else for 12 of the first 14 years they were in conference. It was one weak *** conference in the 80’s and 90’s save maybe a year here and there.

This is not true. Florida State was what Bama and Clemson are now. Is the ACC Clemson and everyone else now?

There were multiple years during that run where 4/9 ACC teams finished top 25. There wasn’t a year with less than 2.

This year 2/14 ACC teams finished top 25 and we only played 1.
 

iceeater1969

Helluva Engineer
Messages
9,628
Ice, no problem. The .505 Power Factor is from a 3-9 record. Power Factor is based on wins/losses as well as SoS and home/away. But you have to win the games to get much credit at all (baseball gives a lot more credit for losses in their RPI).

You are right that we played really good teams away that year: the Strength of Schedule was .712 and that is without a bowl game which raises the SoS.
When i ssw the first series against nd, i knew the first 2ctea
As I pointed out in another thread, there's nothing that makes statistics more gratifying then cherry-picking. The usual way to compare coaches is by their overall records for all years. What you are saying is that we have to be real careful about that.

Ok, do the analysis you suggest and come back to see us. Until you do there doesn't seem to be much reason to take you seriously. I might add that you will have to adjust opponents across eras to make the comparisons valid. When I first started watching Tech football back in the late 50s, Tulane was a tough game.
At the hotel (after the tulane game ) and just before the ND 15 game, i asked a coach if we could expect to see gt scoring game continue. He said we are about to play grown men and tulane didnt do us any favors by laying down (we score 21 in 4th- tulane - twice tulane had 9 men on field).
Back to graph

Navy, could the power factor Imo, t gives too much credit to our big victories against lessor teams who have no resources to play against our scheme w a genius calling the plays.

In 15 the first 2 games we were close to 80 points in the first half. We scored 17 point/ quarter for those 8 quarters and from then on we scored about 6 points per quarter.

I am wondering if the power model gives too much reward reward for big victories over really bad teams.

I am concerned this high level look could be giving us a higher than actual rating in 15 and 18 ( in 18 usf, bg, Louisville and even vt for some reason stayed in a bad alignment that allowed qb or bb end run w zone blocking) when w slaugthered teams. How is this handled in model?

Your data shows that gt under cpj was """ NOT """improved over Gailey who was fired.

Imo, Gt was and is wanting an upward trend from Gailey . Matching Gailey is not acceptable. The cpj years ( during which cpj s genius allowed us to underfund football and burned him out) has no upward trend.

If model is biased up for big victories, we could be slightly down under cpj which would mean it may take a while to show an upward trend.
I am hopeful we can show real progress over next 4 years.
I like the model andchope u will keep it going .

Ps - here is picture of alcorn recruiter's car at Pensacola high looking to see the head coach. He was out to start meeting the coaches as alcorn has decided to recruit a larger area.

20190515_155122.jpg
 

Augusta_Jacket

Moderator
Staff member
Messages
8,093
Location
Augusta, Georgia
Your data shows that gt under cpj was """ NOT """improved over Gailey who was fired.

Imo, Gt was and is wanting an upward trend from Gailey . Matching Gailey is not acceptable. The cpj years ( during which cpj s genius allowed us to underfund football and burned him out) has no upward trend.

IMO, the model shows great overall records, and the two (CG and CPJ) were statistical ties in that regard. What the model doesn't really show well is the positive deviation from norm was greater under CPJ than under CCG. CCG won more than 7 games once. In 2006 he won 9. CPJ won more than 7 in 5 of his 11 seasons, including two 11 win seasons. The model penalizes CPJ for the three losing seasons. In 2010 we lost JmfN and limped to the finish at 6-6 before losing the bowl game. In 2015 the wheels fell off between graduation and injuries. In 2017 we were a very middle of the road team that lost out on a P5 game due to the hurricane.*

In all, I think the model and datasets paint a great picture of the overall trend of the program, but you have to drill down into the individual tenures of the coaches to truly paint a picture of the coaches strengths and weaknesses.

As per usual, great job @GTNavyNuke


*To this day, the SINGLE greatest failing of both TStan and CPJ is not proactively securing a 12th game early in the season to guarantee a bowl berth.
 

Augusta_Jacket

Moderator
Staff member
Messages
8,093
Location
Augusta, Georgia
IMO, the model shows great overall records, and the two (CG and CPJ) were statistical ties in that regard. What the model doesn't really show well is the positive deviation from norm was greater under CPJ than under CCG. CCG won more than 7 games once. In 2006 he won 9. CPJ won more than 7 in 5 of his 11 seasons, including two 11 win seasons. The model penalizes CPJ for the three losing seasons. In 2010 we lost JmfN and limped to the finish at 6-6 before losing the bowl game. In 2015 the wheels fell off between graduation and injuries. In 2017 we were a very middle of the road team that lost out on a P5 game due to the hurricane.*

In all, I think the model and datasets paint a great picture of the overall trend of the program, but you have to drill down into the individual tenures of the coaches to truly paint a picture of the coaches strengths and weaknesses.

As per usual, great job @GTNavyNuke


*To this day, the SINGLE greatest failing of both TStan and CPJ is not proactively securing a 12th game early in the season to guarantee a bowl berth.

I meant that first sentence to start: IMO, the model does a great job of comparing overall records,...
 
Top