A little more concerned

DallasBuzzFan

Georgia Tech Fan
Messages
71
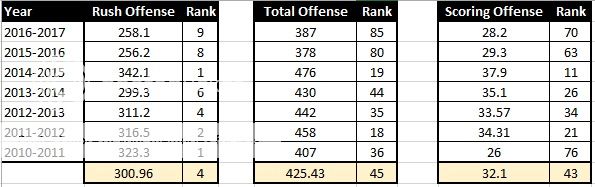
I was about to post “Why can’t everyone relax?” Then I started looking at stats to back up what I thought was cause for optimism.

My original thoughts were that we have basically always just plugged in people and kept on keeping on. But even last year with what we felt were almost unreplaceable players, we had a very sub-par year compared to previous years offensively.

Last year we had JT, Dedrick, Marshall and arguably one of our best center in the CPJ era and our production wasn’t much to write home about.

Offense%20Stats_zpssjpeh9zu.jpg
 

sidewalkGTfan

Helluva Engineer
Messages
1,276
At the end of the season we were 9-4 which I'd sign up for just about every year, but we definitely had some "grinder" of games that we won. I haven't looked up actual game stats but BC, Mercer (to a degree), UVA and UGA were all games that we won that I wouldn't say our O was great in. Even the bowl game, where we scored 33 points, felt like a game that our O played it's B- game.

Long story short, we've probably had 3-4 other seasons under CPJ that the O was better than last year's.
 

Andewa

Jolly Good Fellow
Messages
257
I don't mean to be disrespectful, but unless you normalize your data by dividing by number of drives, your tables will mislead you. (Apologies if you've already done so)
 

AE 87

Helluva Engineer
Messages
13,016
At the end of the season we were 9-4 which I'd sign up for just about every year, but we definitely had some "grinder" of games that we won. I haven't looked up actual game stats but BC, Mercer (to a degree), UVA and UGA were all games that we won that I wouldn't say our O was great in. Even the bowl game, where we scored 33 points, felt like a game that our O played it's B- game.

Long story short, we've probably had 3-4 other seasons under CPJ that the O was better than last year's.

IIrc, 2010, 2013, and 2015 were the only years worse.
 

DallasBuzzFan

Georgia Tech Fan
Messages
71
Yeah, I was just shocked to see that we have typically rocked along between the top 15-35 in the nation in Total offense and scoring offense, then all of the sudden the past two years (even with our players back) we were between 70-85. That's an alarming drop off in production.
 

jgtengineer

Helluva Engineer
Messages
2,736
Yeah, I was just shocked to see that we have typically rocked along between the top 15-35 in the nation in Total offense and scoring offense, then all of the sudden the past two years (even with our players back) we were between 70-85. That's an alarming drop off in production.


Production didn't really drop last year, we had FAR fewer drives that we have in the past. Part of that was ironically our defense didn't do a lot of breaking and the only footrace game we had we had what 4 drives stall in the redzone against UNC.

Basically last year we were extremely explosive on offense ( think about the virginia and VT games where we had many tds of over 50 yards.) and very bendy on defense.

Rather than our offense scoring quick and then thiers scoring fast and possessions going up our defense would allow a 13-14 play drive that ate up the clock, and either force a field goal or surrender the TD then we would turn around and score fast and it begin again. Our numbers last year were pretty much in line with 2008 when we death marched all over the field and had a defense with a bit better track record of getting of the field.

In 2014, arguably our best year statistically we had a defense that got a lot of turnovers giving our offense short fields for quick drives combined with an offense that was explosive.

People are scoring more points in general in games now thanks to the proliferation of the spread and the weakening of defenses in some of the conferences(big 12, pac, g5's) so we are always going to be on the low end of scoring offense simply because we shorten games.

The only team that had both a top 10 scoring offense and top 10 scoring defense last year was Washington. Typically the highest scoring offenses had lower ranked scoring defenses. which yielded more drives.

Food for thought our scoring defense last year was 39. in 2014 it was 53rd
 

ibeattetris

Helluva Engineer
Messages
3,551
Adding number of plays, number of drives and time of possession would definitely add some useful data points to the discussion =)
FEI numbers for 2016 vs 2015 aren't even close, so I am not sure if looking at the stats in terms of absolute numbers is painting a clear picture.
 

jeffgt14

We don't quite suck as much anymore.
Messages
5,789
Location
Mt Juliet, TN
We also didn’t have any stat padding games last year.
2015 we had 131 points and 915 Rush Yards total after the first 2 games.
2014 we didn’t really pad any games either. We were incredibly efficient offensively
2013 we had 192 points and 1190 Rush Yards between Elon, Syracuse, & Alabama A&M
2012 we had 115 points and 930 Rush Yards between Presbyterian and UVA
2011 we had 178 points and 1283 Rush Yards between W. Carolina, MTSU, & Kansas

Excluding 2014 because I can’t pick and specific games where it looked like we may have “padded” stats, we average 61.6 points and 431.8 Rush Yards per cupcake game.

Let’s assume our 2 cupcakes in 2016 were Mercer & Vandy (the 2 we blew out the most). We averaged 36.5 points and 326.5 Rush yards. Significantly under our CGA (Cupcake Game Average). Add a total of 50 more points and 210 Rush Yards to our yearly totals and see how we stack up there.

There are so many variables to sports stats you can pretty much just pick your own narrative. You can go off points/yards per drive too but even those have variables such as average starting field position, defensive performance, etc.

The biggest thing I’ve seen in how we perform under CPJ’s tenure is turnovers (mainly offensively but defensively too). We have lost so many games because we have turned the ball over multiple times. We seem to have a difficult time recovering from a bad turnover too.

Anyways can I coin the CGA stat or has that been taken already?
 

DallasBuzzFan

Georgia Tech Fan
Messages
71
So.... as bad as these stats are for the defense, our defense really hasn't sucked as bad as the stats say they do? Awesome, I change my prediction to 13-0. J/K

I actually love CPJ's coaching and his offense. I honestly think that CPJ's offense is plug and play. I don't have any reason to believe that KB or Jerry can't be as good as Marshall or Dedrick would have been. I honestly don't know that one QB will be that much different than the other, over the whole season. I just think it will be done differently. I think with MJ at QB the AB's numbers will suffer and the QB numbers will be high and I think that the all around offensive numbers would be better with JQM because I think that he will distribute the ball a lot more.

I just hope that everything comes together this next week.
 

AE 87

Helluva Engineer
Messages
13,016
Okay, so I'm a bigger fan in Efficiency stats than Per Game stats.

The following tables reflect our Points/Drive, Yards/Play and Yards/Carry vs Pwr5 (2014-2016) or BCS AQ (2008-2013) opponents.

upload_2017-8-24_14-50-29.png
upload_2017-8-24_14-50-45.png
upload_2017-8-24_14-51-12.png


So, of these, I think that the point/drive vs Pwr5 is the most important.
 

Andewa

Jolly Good Fellow
Messages
257
Okay, so I'm a bigger fan in Efficiency stats than Per Game stats.

The following tables reflect our Points/Drive, Yards/Play and Yards/Carry vs Pwr5 (2014-2016) or BCS AQ (2008-2013) opponents.

View attachment 2806 View attachment 2807 View attachment 2808

So, of these, I think that the point/drive vs Pwr5 is the most important.

This! So much this! This data is appropriately normalized and gives a clearer picture of our offensive performance. Thank you!
 

Animal02

Banned
Messages
6,269
Location
Southeastern Michigan
We also didn’t have any stat padding games last year.
2015 we had 131 points and 915 Rush Yards total after the first 2 games.
2014 we didn’t really pad any games either. We were incredibly efficient offensively
2013 we had 192 points and 1190 Rush Yards between Elon, Syracuse, & Alabama A&M
2012 we had 115 points and 930 Rush Yards between Presbyterian and UVA
2011 we had 178 points and 1283 Rush Yards between W. Carolina, MTSU, & Kansas

Excluding 2014 because I can’t pick and specific games where it looked like we may have “padded” stats, we average 61.6 points and 431.8 Rush Yards per cupcake game.

Let’s assume our 2 cupcakes in 2016 were Mercer & Vandy (the 2 we blew out the most). We averaged 36.5 points and 326.5 Rush yards. Significantly under our CGA (Cupcake Game Average). Add a total of 50 more points and 210 Rush Yards to our yearly totals and see how we stack up there.

There are so many variables to sports stats you can pretty much just pick your own narrative. You can go off points/yards per drive too but even those have variables such as average starting field position, defensive performance, etc.

The biggest thing I’ve seen in how we perform under CPJ’s tenure is turnovers (mainly offensively but defensively too). We have lost so many games because we have turned the ball over multiple times. We seem to have a difficult time recovering from a bad turnover too.

Anyways can I coin the CGA stat or has that been taken already?
Our stats got padded in Pitt in 2014,. at least for fumble recovering. (y)
 
Top