- Messages
- 9,885
- Location
- Williamsburg Virginia
I’ve done posts the last five years about the history of GT football. Last year’s post was at https://gtswarm.com/threads/114-years-of-gt-football-–-how-will-history-repeat.15192/
I arbitrarily say 115 years since 1904 was Heisman’s first year. He was our first real coach and between 1892 and 1904 we either had no coach or a teacher as coach.
Here’s a graph that shows three things. First in red line, the average JHowell Power Ranking for that coach*. Next in green line the average winning % for that coach. And finally, in the blue bar, the average yearly JHowell ranking finish for that coach. (More on JHowell at http://www.jhowell.net/cf/cfindex.htm ) Bobby Dodd was far and away the best and Bill Lewis the worst. Heisman came in a “respectable” second.
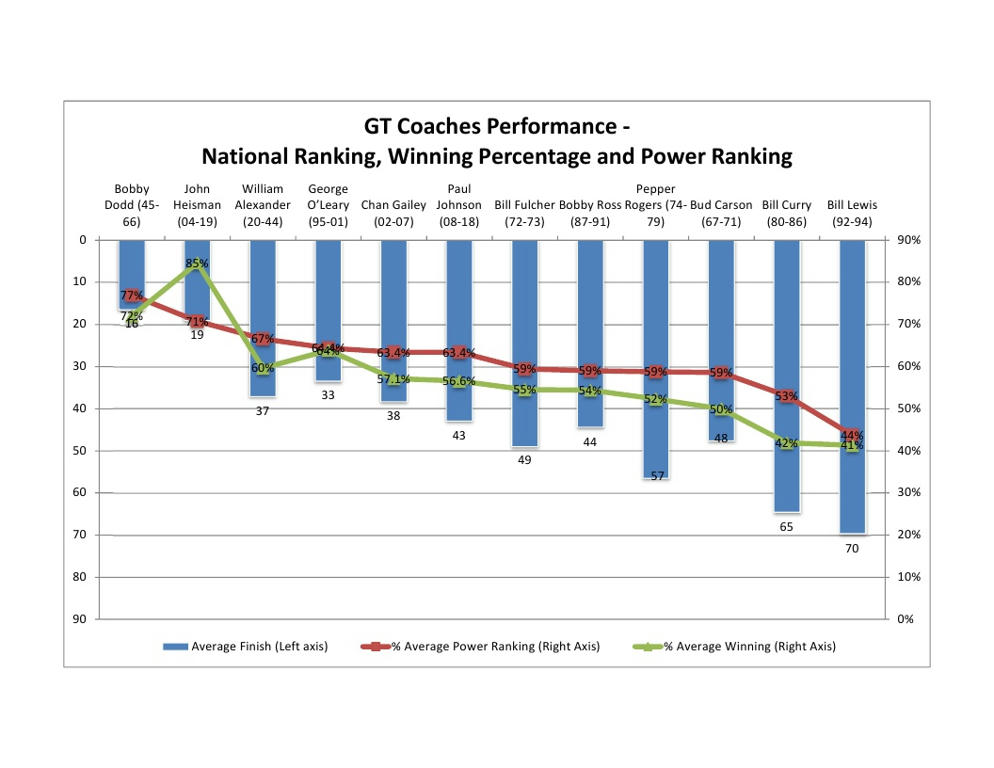
Johnson’s performance is right there with Gailey and below O’Leary. CPJ and Gailey have the same average Power Ranking but Gailey was slightly better in average in team ranking at the end of the year and in Average Winning %. Note I’m talking about performance when comparing coaches and not whether one coach would be better than another in today’s environment including money and recruiting and scholastics and all that. All of these rankings are based on their peers at the time. These are just the facts from an unbiased source.
And here are the yearly Power Ranking results that make up the averages above. Our 2018 final Power Ranking of 63.4% meant that we had a 63.4% chance of beating an average team on a neutral field.
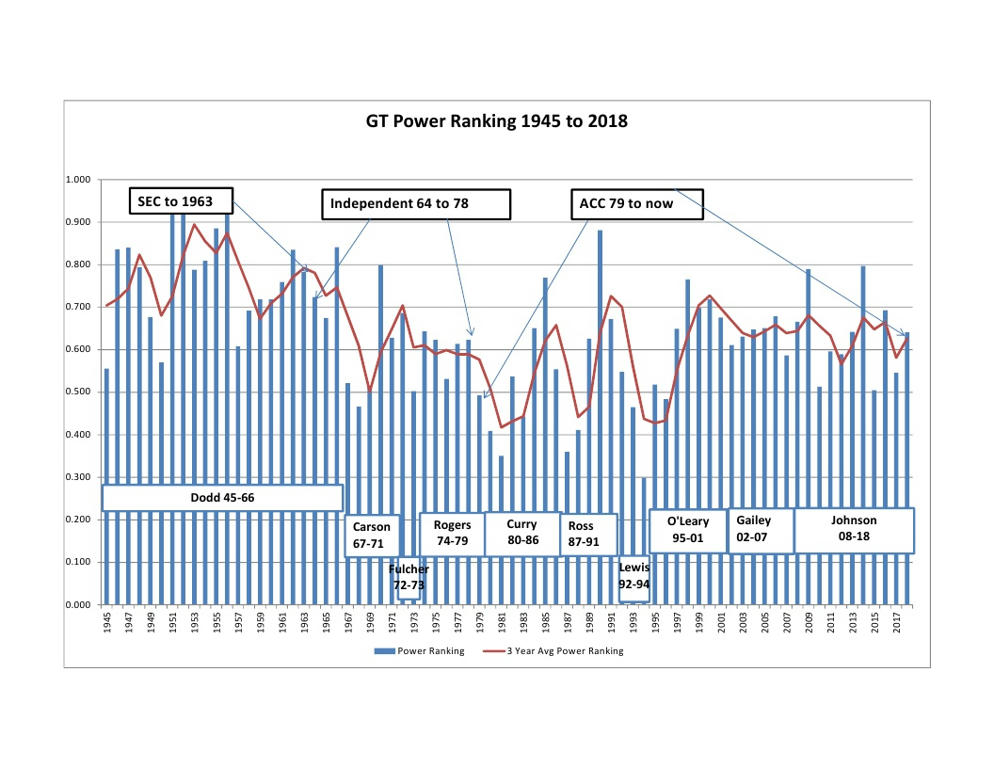
*I like the Power Ranking metric the best – they reflect Strength of Schedule. This has the discussion why https://gtswarm.com/threads/70-years-of-gt-football-–-strength-of-schedule.2489/
I arbitrarily say 115 years since 1904 was Heisman’s first year. He was our first real coach and between 1892 and 1904 we either had no coach or a teacher as coach.
Here’s a graph that shows three things. First in red line, the average JHowell Power Ranking for that coach*. Next in green line the average winning % for that coach. And finally, in the blue bar, the average yearly JHowell ranking finish for that coach. (More on JHowell at http://www.jhowell.net/cf/cfindex.htm ) Bobby Dodd was far and away the best and Bill Lewis the worst. Heisman came in a “respectable” second.
Johnson’s performance is right there with Gailey and below O’Leary. CPJ and Gailey have the same average Power Ranking but Gailey was slightly better in average in team ranking at the end of the year and in Average Winning %. Note I’m talking about performance when comparing coaches and not whether one coach would be better than another in today’s environment including money and recruiting and scholastics and all that. All of these rankings are based on their peers at the time. These are just the facts from an unbiased source.
And here are the yearly Power Ranking results that make up the averages above. Our 2018 final Power Ranking of 63.4% meant that we had a 63.4% chance of beating an average team on a neutral field.
*I like the Power Ranking metric the best – they reflect Strength of Schedule. This has the discussion why https://gtswarm.com/threads/70-years-of-gt-football-–-strength-of-schedule.2489/