- Messages
- 9,901
- Location
- Williamsburg Virginia
I’ve done posts the last four years about the history of GT football. Last year’s was at
https://gtswarm.com/threads/113-years-of-gt-football-%E2%80%93-2015-9-losses-to-2016-9-wins-to-2017.12624/
Here’s a graph that shows three things. First in red line, the average JHowell Power Ranking for that coach*. Next in green line the average winning % for that coach. And finally, in the blue bar, the average yearly JHowell ranking finish for that coach. (More on JHowell at http://www.jhowell.net/cf/cfindex.htm ) Guess what, Bobby Dodd was far and away the best and Bill Lewis the worst. Heisman came in a “respectable” second.
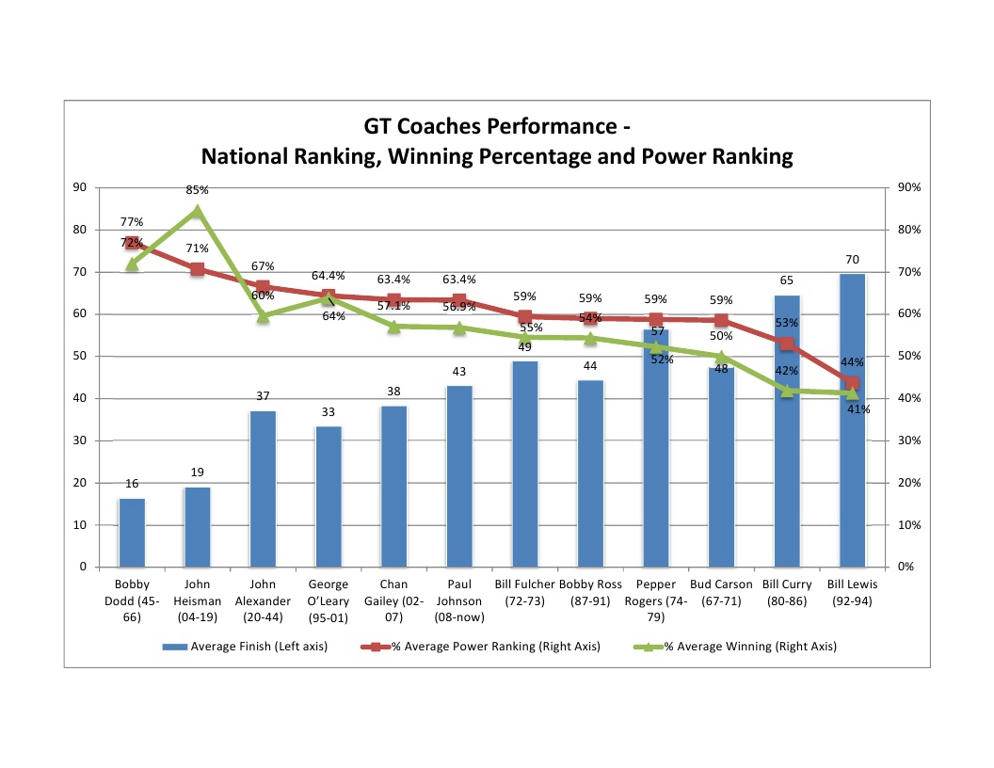
CPJ performance is right there with Gailey and has slipped below O’Leary. CPJ and Gailey have the same average Power Ranking but Gailey was slightly better in average in team ranking at the end of the year and in Average Winning %. A few years ago, I thought CPJ might overtake Alexander but not now.
Note I said performance when comparing coaches and not whether one coach would be better than another in today’s environment. All of these rankings are based on their peers at the time. I know the many reasons given why GT can’t compete like we used to. Regardless, these are the facts from an unbiased source (not alternative facts).
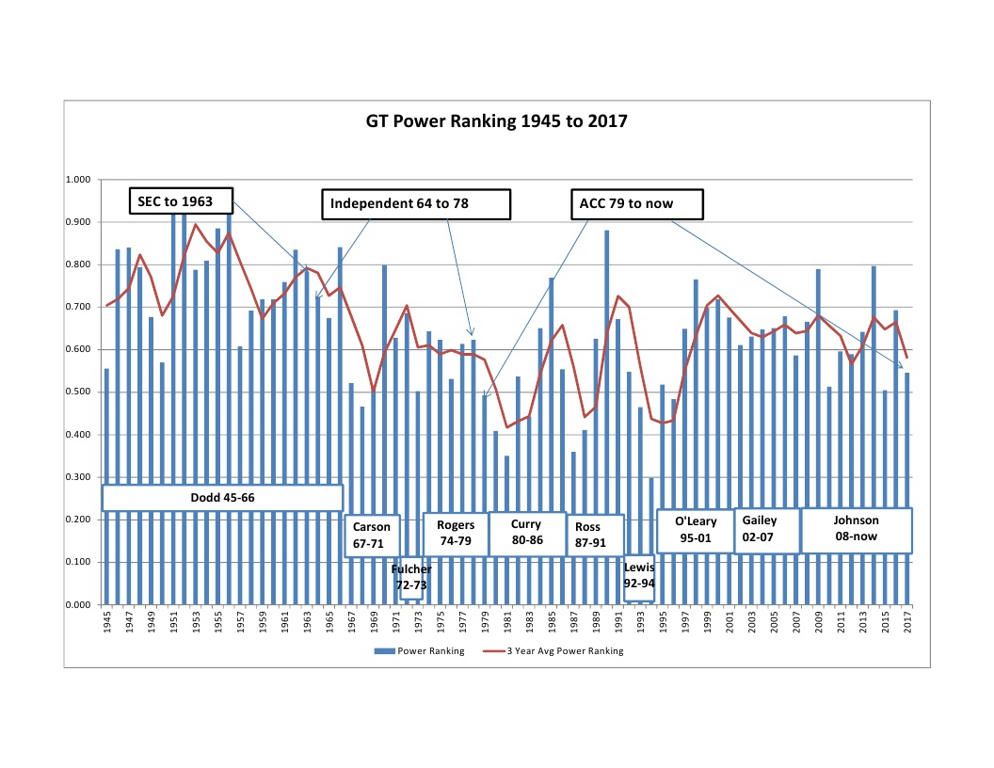
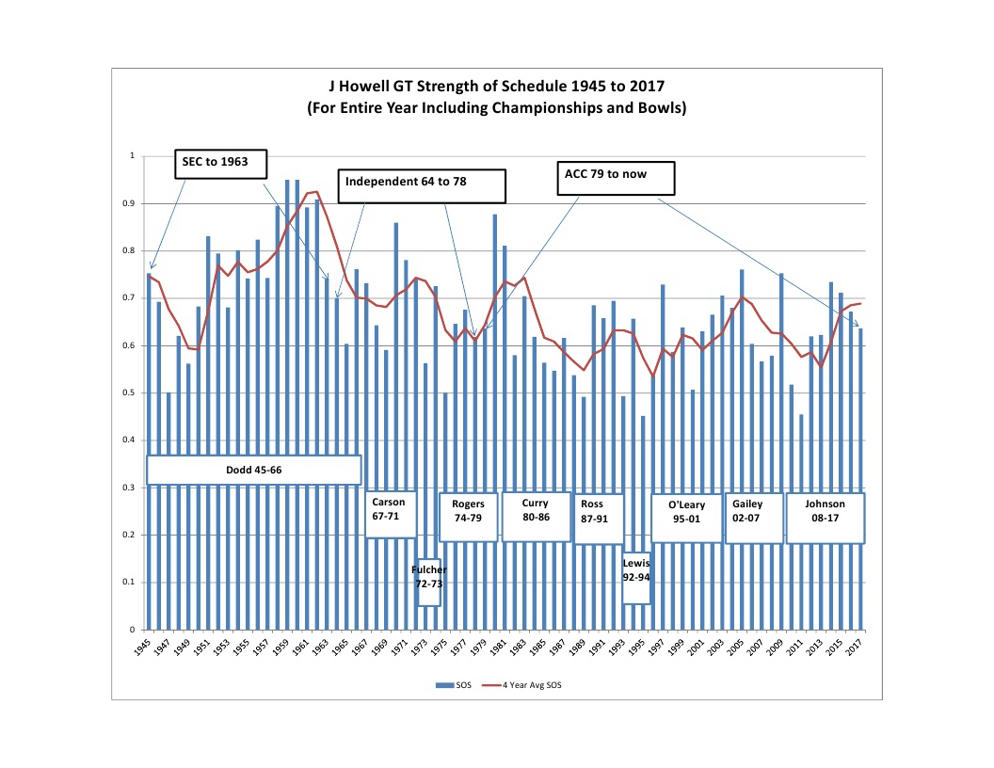
*I like the Power Ranking metric the best – they reflect Strength of Schedule. This has the discussion why https://gtswarm.com/threads/70-years-of-gt-football-–-strength-of-schedule.2489/
https://gtswarm.com/threads/113-years-of-gt-football-%E2%80%93-2015-9-losses-to-2016-9-wins-to-2017.12624/
Here’s a graph that shows three things. First in red line, the average JHowell Power Ranking for that coach*. Next in green line the average winning % for that coach. And finally, in the blue bar, the average yearly JHowell ranking finish for that coach. (More on JHowell at http://www.jhowell.net/cf/cfindex.htm ) Guess what, Bobby Dodd was far and away the best and Bill Lewis the worst. Heisman came in a “respectable” second.
CPJ performance is right there with Gailey and has slipped below O’Leary. CPJ and Gailey have the same average Power Ranking but Gailey was slightly better in average in team ranking at the end of the year and in Average Winning %. A few years ago, I thought CPJ might overtake Alexander but not now.
Note I said performance when comparing coaches and not whether one coach would be better than another in today’s environment. All of these rankings are based on their peers at the time. I know the many reasons given why GT can’t compete like we used to. Regardless, these are the facts from an unbiased source (not alternative facts).
*I like the Power Ranking metric the best – they reflect Strength of Schedule. This has the discussion why https://gtswarm.com/threads/70-years-of-gt-football-–-strength-of-schedule.2489/